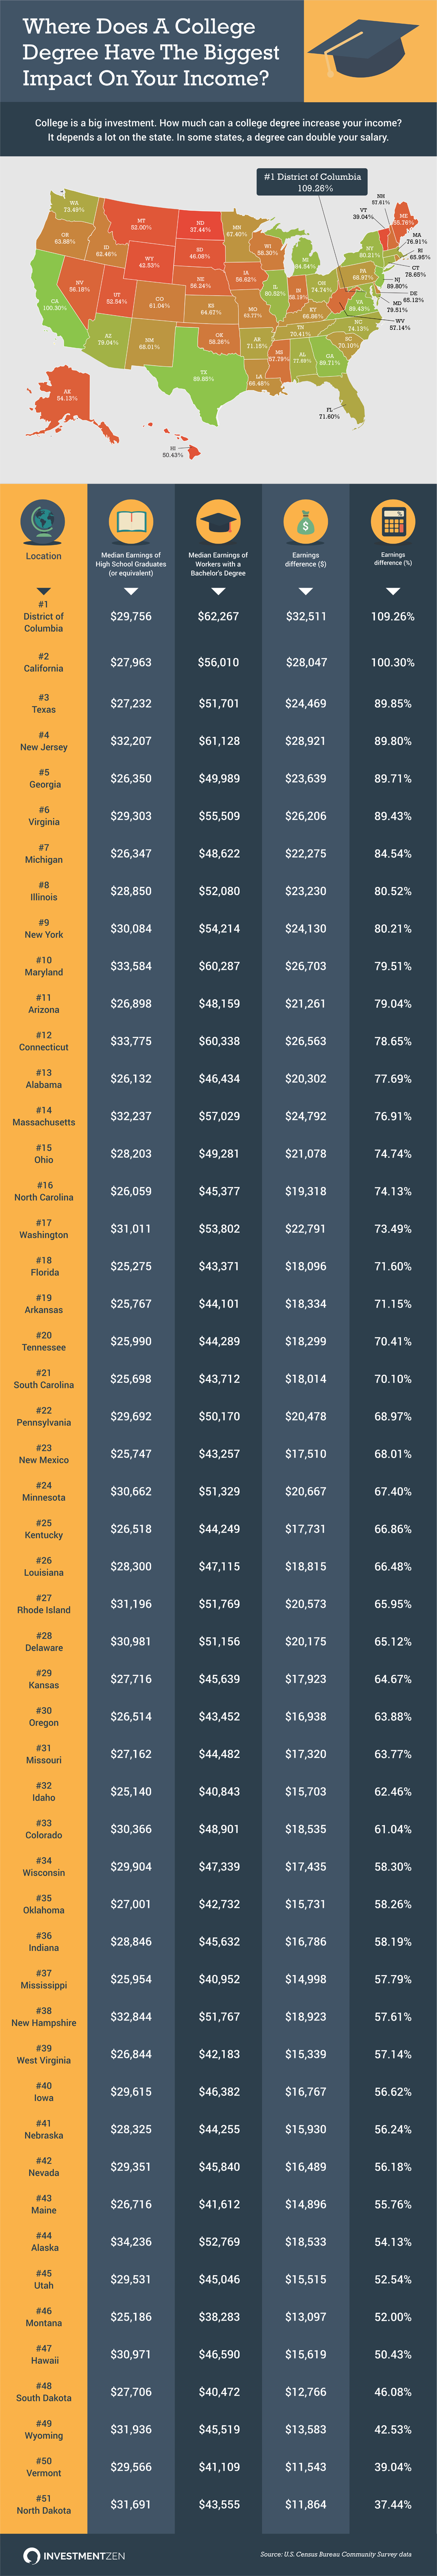
This map shows the states where a bachelor’s degree impacts your income the most. District of Columbia comes in number 1 with bachelor’s degree-holders earning over 109% more than high school graduates (or equivalent) with California a close second at just over 100% more than high school graduates while North Dakota rounds out the list with bachelor’s degree-holders earning only about 37% more than high school graduates.
SHARE THIS INFOGRAPHIC ON YOUR SITE WITH THE FOLLOWING CODE:
<p><a href='http://staging.investmentzen.com/data-visualization/where-does-a-college-degree-have-the-biggest-impact-on-your-income/'><img src='https://investmentzen-569f.kxcdn.com/blog/wp-content/uploads/2017/05/Where-Does-A-College-Degree-Have-The-Biggest-Impact-On-Your-Income.png' alt='Where Does A College Degree Have The Biggest Impact On Your Income' width='800px' border='0' /></a></p>

<p>Via: <a href="http://staging.investmentzen.com/data-visualization/where-does-a-college-degree-have-the-biggest-impact-on-your-income/">InvestmentZen.com</a></p>
#1 District of Columbia
- Median Earnings of High School Graduates (or equivalent): $29,756
- Median Earnings of Workers with a Bachelor’s Degree: $62,267
- Earnings difference: $32,511
- The percentage the Bachelor’s Degree earns more than the high school graduate (or equivalent): 109.26%
#2 California
- Median Earnings of High School Graduates (or equivalent): $27,963
- Median Earnings of Workers with a Bachelor’s Degree: $56,010
- Earnings difference: $28,047
- The percentage the Bachelor’s Degree earns more than the high school graduate (or equivalent): 100.30%
#3 Texas
- Median Earnings of High School Graduates (or equivalent): $27,232
- Median Earnings of Workers with a Bachelor’s Degree: $51,701
- Earnings difference: $24,469
- The percentage the Bachelor’s Degree earns more than the high school graduate (or equivalent): 89.85%
#4 New Jersey
- Median Earnings of High School Graduates (or equivalent): $32,207
- Median Earnings of Workers with a Bachelor’s Degree: $61,128
- Earnings difference: $28,921
- The percentage the Bachelor’s Degree earns more than the high school graduate (or equivalent): 89.80%
#5 Georgia
- Median Earnings of High School Graduates (or equivalent): $26,350
- Median Earnings of Workers with a Bachelor’s Degree: $49,989
- Earnings difference: $23,639
- The percentage the Bachelor’s Degree earns more than the high school graduate (or equivalent): 89.71%
#6 Virginia
- Median Earnings of High School Graduates (or equivalent): $29,303
- Median Earnings of Workers with a Bachelor’s Degree: $55,509
- Earnings difference: $26,206
- The percentage the Bachelor’s Degree earns more than the high school graduate (or equivalent): 89.43%
#7 Michigan
- Median Earnings of High School Graduates (or equivalent): $26,347
- Median Earnings of Workers with a Bachelor’s Degree: $48,622
- Earnings difference: $22,275
- The percentage the Bachelor’s Degree earns more than the high school graduate (or equivalent): 84.54%
#8 Illinois
- Median Earnings of High School Graduates (or equivalent): $28,850
- Median Earnings of Workers with a Bachelor’s Degree: $52,080
- Earnings difference: $23,230
- The percentage the Bachelor’s Degree earns more than the high school graduate (or equivalent): 80.52%
#9 New York
- Median Earnings of High School Graduates (or equivalent): $30,084
- Median Earnings of Workers with a Bachelor’s Degree: $54,214
- Earnings difference: $24,130
- The percentage the Bachelor’s Degree earns more than the high school graduate (or equivalent): 80.21%
#10 Maryland
- Median Earnings of High School Graduates (or equivalent): $33,584
- Median Earnings of Workers with a Bachelor’s Degree: $60,287
- Earnings difference: $26,703
- The percentage the Bachelor’s Degree earns more than the high school graduate (or equivalent): 79.51%
#11 Arizona
- Median Earnings of High School Graduates (or equivalent): $26,898
- Median Earnings of Workers with a Bachelor’s Degree: $48,159
- Earnings difference: $21,261
- The percentage the Bachelor’s Degree earns more than the high school graduate (or equivalent): 79.04%
#12 Connecticut
- Median Earnings of High School Graduates (or equivalent): $33,775
- Median Earnings of Workers with a Bachelor’s Degree: $60,338
- Earnings difference: $26,563
- The percentage the Bachelor’s Degree earns more than the high school graduate (or equivalent): 78.65%
#13 Alabama
- Median Earnings of High School Graduates (or equivalent): $26,132
- Median Earnings of Workers with a Bachelor’s Degree: $46,434
- Earnings difference: $20,302
- The percentage the Bachelor’s Degree earns more than the high school graduate (or equivalent): 77.69%
#14 Massachusetts
- Median Earnings of High School Graduates (or equivalent): $32,237
- Median Earnings of Workers with a Bachelor’s Degree: $57,029
- Earnings difference: $24,792
- The percentage the Bachelor’s Degree earns more than the high school graduate (or equivalent): 76.91%
#15 Ohio
- Median Earnings of High School Graduates (or equivalent): $28,203
- Median Earnings of Workers with a Bachelor’s Degree: $49,281
- Earnings difference: $21,078
- The percentage the Bachelor’s Degree earns more than the high school graduate (or equivalent): 74.74%
#16 North Carolina
- Median Earnings of High School Graduates (or equivalent): $26,059
- Median Earnings of Workers with a Bachelor’s Degree: $45,377
- Earnings difference: $19,318
- The percentage the Bachelor’s Degree earns more than the high school graduate (or equivalent): 74.13%
#17 Washington
- Median Earnings of High School Graduates (or equivalent): $31,011
- Median Earnings of Workers with a Bachelor’s Degree: $53,802
- Earnings difference: $22,791
- The percentage the Bachelor’s Degree earns more than the high school graduate (or equivalent): 73.49%
#18 Florida
- Median Earnings of High School Graduates (or equivalent): $25,275
- Median Earnings of Workers with a Bachelor’s Degree: $43,371
- Earnings difference: $18,096
- The percentage the Bachelor’s Degree earns more than the high school graduate (or equivalent): 71.60%
#19 Arkansas
- Median Earnings of High School Graduates (or equivalent): $25,767
- Median Earnings of Workers with a Bachelor’s Degree: $44,101
- Earnings difference: $18,334
- The percentage the Bachelor’s Degree earns more than the high school graduate (or equivalent): 71.15%
#20 Tennessee
- Median Earnings of High School Graduates (or equivalent): $25,990
- Median Earnings of Workers with a Bachelor’s Degree: $44,289
- Earnings difference: $18,299
- The percentage the Bachelor’s Degree earns more than the high school graduate (or equivalent): 70.41%
#21 South Carolina
- Median Earnings of High School Graduates (or equivalent): $25,698
- Median Earnings of Workers with a Bachelor’s Degree: $43,712
- Earnings difference: $18,014
- The percentage the Bachelor’s Degree earns more than the high school graduate (or equivalent): 70.10%
#22 Pennsylvania
- Median Earnings of High School Graduates (or equivalent): $29,692
- Median Earnings of Workers with a Bachelor’s Degree: $50,170
- Earnings difference: $20,478
- The percentage the Bachelor’s Degree earns more than the high school graduate (or equivalent): 68.97%
#23 New Mexico
- Median Earnings of High School Graduates (or equivalent): $25,747
- Median Earnings of Workers with a Bachelor’s Degree: $43,257
- Earnings difference: $17,510
- The percentage the Bachelor’s Degree earns more than the high school graduate (or equivalent): 68.01%
#24 Minnesota
- Median Earnings of High School Graduates (or equivalent): $30,662
- Median Earnings of Workers with a Bachelor’s Degree: $51,329
- Earnings difference: $20,667
- The percentage the Bachelor’s Degree earns more than the high school graduate (or equivalent): 67.40%
#25 Kentucky
- Median Earnings of High School Graduates (or equivalent): $26,518
- Median Earnings of Workers with a Bachelor’s Degree: $44,249
- Earnings difference: $17,731
- The percentage the Bachelor’s Degree earns more than the high school graduate (or equivalent): 66.86%
#26 Louisiana
- Median Earnings of High School Graduates (or equivalent): $28,300
- Median Earnings of Workers with a Bachelor’s Degree: $47,115
- Earnings difference: $18,815
- The percentage the Bachelor’s Degree earns more than the high school graduate (or equivalent): 66.48%
#27 Rhode Island
- Median Earnings of High School Graduates (or equivalent): $31,196
- Median Earnings of Workers with a Bachelor’s Degree: $51,769
- Earnings difference: $20,573
- The percentage the Bachelor’s Degree earns more than the high school graduate (or equivalent): 65.95%
#28 Delaware
- Median Earnings of High School Graduates (or equivalent): $30,981
- Median Earnings of Workers with a Bachelor’s Degree: $51,156
- Earnings difference: $20,175
- The percentage the Bachelor’s Degree earns more than the high school graduate (or equivalent): 65.12%
#29 Kansas
- Median Earnings of High School Graduates (or equivalent): $27,716
- Median Earnings of Workers with a Bachelor’s Degree: $45,639
- Earnings difference: $17,923
- The percentage the Bachelor’s Degree earns more than the high school graduate (or equivalent): 64.67%
#30 Oregon
- Median Earnings of High School Graduates (or equivalent): $26,514
- Median Earnings of Workers with a Bachelor’s Degree: $43,452
- Earnings difference: $16,938
- The percentage the Bachelor’s Degree earns more than the high school graduate (or equivalent): 63.88%
#31 Missouri
- Median Earnings of High School Graduates (or equivalent): $27,162
- Median Earnings of Workers with a Bachelor’s Degree: $44,482
- Earnings difference: $17,320
- The percentage the Bachelor’s Degree earns more than the high school graduate (or equivalent): 63.77%
#32 Idaho
- Median Earnings of High School Graduates (or equivalent): $25,140
- Median Earnings of Workers with a Bachelor’s Degree: $40,843
- Earnings difference: $15,703
- The percentage the Bachelor’s Degree earns more than the high school graduate (or equivalent): 62.46%
#33 Colorado
- Median Earnings of High School Graduates (or equivalent): $30,366
- Median Earnings of Workers with a Bachelor’s Degree: $48,901
- Earnings difference: $18,535
- The percentage the Bachelor’s Degree earns more than the high school graduate (or equivalent): 61.04%
#34 Wisconsin
- Median Earnings of High School Graduates (or equivalent): $29,904
- Median Earnings of Workers with a Bachelor’s Degree: $47,339
- Earnings difference: $17,435
- The percentage the Bachelor’s Degree earns more than the high school graduate (or equivalent): 58.30%
#35 Oklahoma
- Median Earnings of High School Graduates (or equivalent): $27,001
- Median Earnings of Workers with a Bachelor’s Degree: $42,732
- Earnings difference: $15,731
- The percentage the Bachelor’s Degree earns more than the high school graduate (or equivalent): 58.26%
#36 Indiana
- Median Earnings of High School Graduates (or equivalent): $28,846
- Median Earnings of Workers with a Bachelor’s Degree: $45,632
- Earnings difference: $16,786
- The percentage the Bachelor’s Degree earns more than the high school graduate (or equivalent): 58.19%
#37 Mississippi
- Median Earnings of High School Graduates (or equivalent): $25,954
- Median Earnings of Workers with a Bachelor’s Degree: $40,952
- Earnings difference: $14,998
- The percentage the Bachelor’s Degree earns more than the high school graduate (or equivalent): 57.79%
#38 New Hampshire
- Median Earnings of High School Graduates (or equivalent): $32,844
- Median Earnings of Workers with a Bachelor’s Degree: $51,767
- Earnings difference: $18,923
- The percentage the Bachelor’s Degree earns more than the high school graduate (or equivalent): 57.61%
#39 West Virginia
- Median Earnings of High School Graduates (or equivalent): $26,844
- Median Earnings of Workers with a Bachelor’s Degree: $42,183
- Earnings difference: $15,339
- The percentage the Bachelor’s Degree earns more than the high school graduate (or equivalent): 57.14%
#40 Iowa
- Median Earnings of High School Graduates (or equivalent): $29,615
- Median Earnings of Workers with a Bachelor’s Degree: $46,382
- Earnings difference: $16,767
- The percentage the Bachelor’s Degree earns more than the high school graduate (or equivalent): 56.62%
#41 Nebraska
- Median Earnings of High School Graduates (or equivalent): $28,325
- Median Earnings of Workers with a Bachelor’s Degree: $44,255
- Earnings difference: $15,930
- The percentage the Bachelor’s Degree earns more than the high school graduate (or equivalent): 56.24%
#42 Nevada
- Median Earnings of High School Graduates (or equivalent): $29,351
- Median Earnings of Workers with a Bachelor’s Degree: $45,840
- Earnings difference: $16,489
- The percentage the Bachelor’s Degree earns more than the high school graduate (or equivalent): 56.18%
#43 Maine
- Median Earnings of High School Graduates (or equivalent): $26,716
- Median Earnings of Workers with a Bachelor’s Degree: $41,612
- Earnings difference: $14,896
- The percentage the Bachelor’s Degree earns more than the high school graduate (or equivalent): 55.76%
#44 Alaska
- Median Earnings of High School Graduates (or equivalent): $34,236
- Median Earnings of Workers with a Bachelor’s Degree: $52,769
- Earnings difference: $18,533
- The percentage the Bachelor’s Degree earns more than the high school graduate (or equivalent): 54.13%
#45 Utah
- Median Earnings of High School Graduates (or equivalent): $29,531
- Median Earnings of Workers with a Bachelor’s Degree: $45,046
- Earnings difference: $15,515
- The percentage the Bachelor’s Degree earns more than the high school graduate (or equivalent): 52.54%
#46 Montana
- Median Earnings of High School Graduates (or equivalent): $25,186
- Median Earnings of Workers with a Bachelor’s Degree: $38,283
- Earnings difference: $13,097
- The percentage the Bachelor’s Degree earns more than the high school graduate (or equivalent): 52.00%
#47 Hawaii
- Median Earnings of High School Graduates (or equivalent): $30,971
- Median Earnings of Workers with a Bachelor’s Degree: $46,590
- Earnings difference: $15,619
- The percentage the Bachelor’s Degree earns more than the high school graduate (or equivalent): 50.43%
#48 South Dakota
- Median Earnings of High School Graduates (or equivalent): $27,706
- Median Earnings of Workers with a Bachelor’s Degree: $40,472
- Earnings difference: $12,766
- The percentage the Bachelor’s Degree earns more than the high school graduate (or equivalent): 46.08%
#49 Wyoming
- Median Earnings of High School Graduates (or equivalent): $31,936
- Median Earnings of Workers with a Bachelor’s Degree: $45,519
- Earnings difference: $13,583
- The percentage the Bachelor’s Degree earns more than the high school graduate (or equivalent): 42.53%
#50 Vermont
- Median Earnings of High School Graduates (or equivalent): $29,566
- Median Earnings of Workers with a Bachelor’s Degree: $41,109
- Earnings difference: $11,543
- The percentage the Bachelor’s Degree earns more than the high school graduate (or equivalent): 39.04%
#51 North Dakota
- Median Earnings of High School Graduates (or equivalent): $31,691
- Median Earnings of Workers with a Bachelor’s Degree: $43,555
- Earnings difference: $11,864
- The percentage the Bachelor’s Degree earns more than the high school graduate (or equivalent): 37.44%