Deprecated: Implicit conversion from float 1756512727.810738 to int loses precision in /www/investmentzen_357/public/blog/wp-content/plugins/intelly-related-posts/includes/classes/utils/Logger.php on line 93
Deprecated: Implicit conversion from float 1756512727.810874 to int loses precision in /www/investmentzen_357/public/blog/wp-content/plugins/intelly-related-posts/includes/classes/utils/Logger.php on line 93
SHARE THIS INFOGRAPHIC ON YOUR SITE WITH THE FOLLOWING CODE:
<p><a href='http://staging.investmentzen.com/data-visualization/the-real-differences-between-iphone-vs-android-users/'><img src='https://investmentzen-569f.kxcdn.com/blog/wp-content/uploads/2017/05/The-Real-Differences-Between-iPhone-vs.-Android-Users.jpg' alt='The Real Differences Between iPhone vs. Android Users' width='800px' border='0' /></a></p>

<p>Via: <a href="http://staging.investmentzen.com/data-visualization/the-real-differences-between-iphone-vs-android-users/">InvestmentZen.com</a></p>
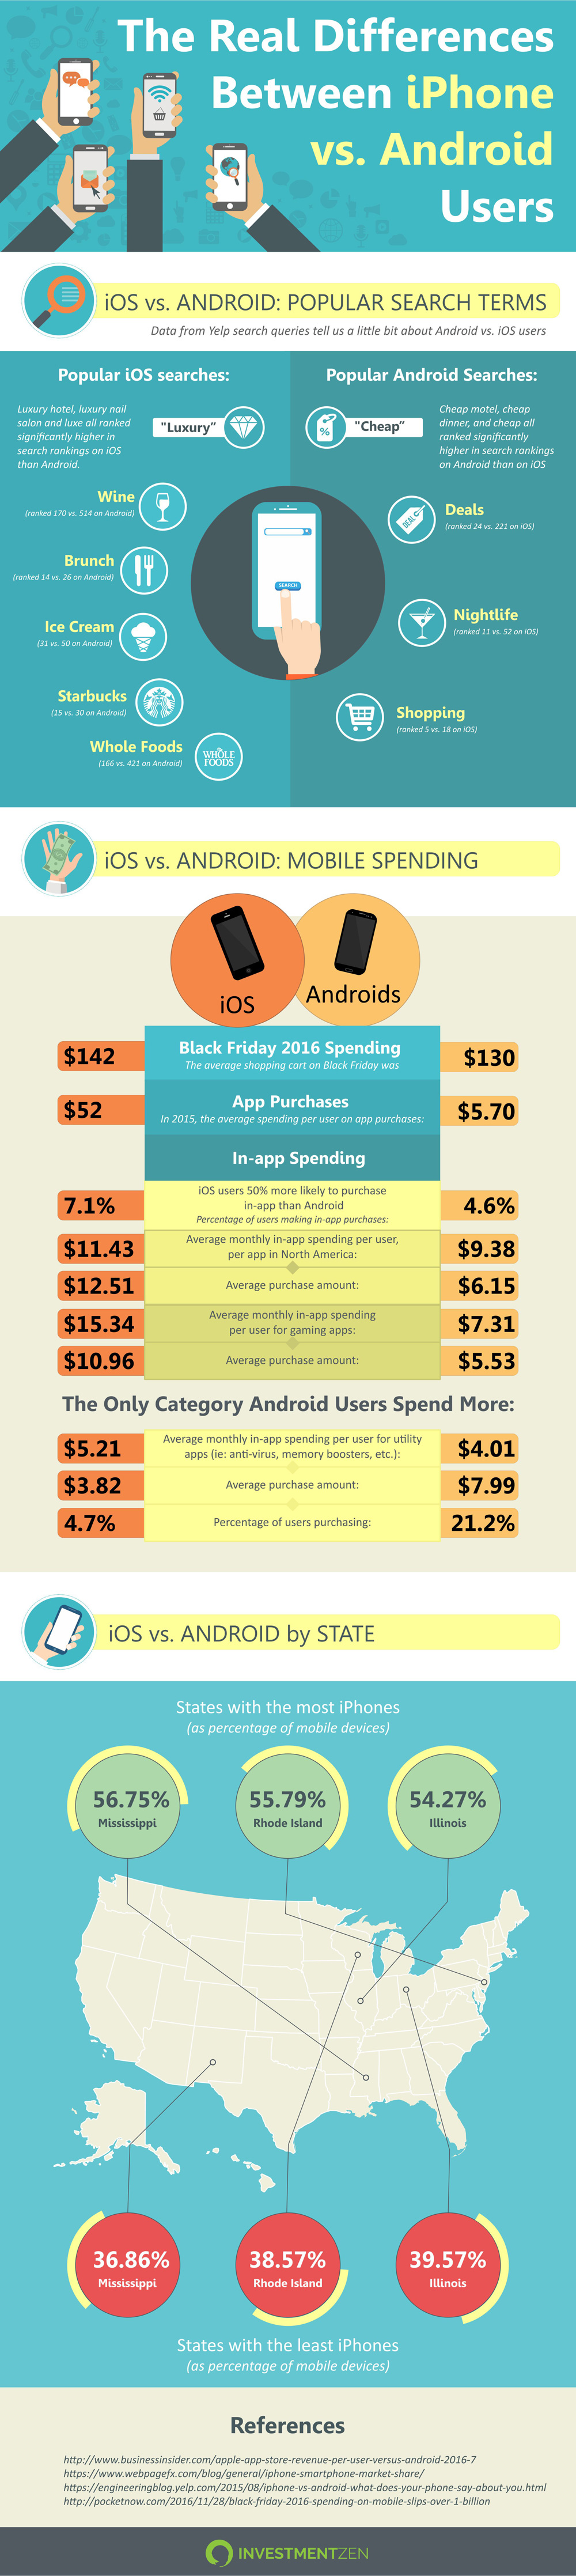
iOS vs. ANDROID: POPULAR SEARCH TERMS
Data from Yelp search queries tell us a little bit about Android vs. iOS users
Popular iOS searches:
- “Luxury” – Luxury hotel, luxury nail salon and luxe all ranked significantly higher in search rankings on iOS than Android
- Wine (ranked 170 vs. 514 on Android)
- Brunch (ranked 14 vs. 26 on Android)
- Ice Cream (31 vs. 50 on Android)
- Starbucks (15 vs. 30 on Android)
- Whole Foods (166 vs. 421 on Android)
Popular Android Searches:
- “Cheap” – cheap motel, cheap dinner, and cheap all ranked significantly higher in search rankings on Android than on iOS
- Deals (ranked 24 vs. 221 on iOS)
- Nightlife (ranked 11 vs. 52 on iOS)
- Shopping (ranked 5 vs. 18 on iOS)
iOS vs. ANDROID: MOBILE SPENDING
Black Friday 2016 Spending:
The average shopping cart on iPhones on Black Friday was $142 vs. $130 on Androids
App Purchases:
In 2015, the average spending per user on app purchases:
iOS: $52 | Android: $5.70
In-app Spending:
iOS users 50% more likely to purchase in-app in the first place than Android
Percentage of users making in-app purchases:
iOS: 7.1% | Android 4.6%
Average monthly in-app spending per user, per app in North America:
iOS: $11.43 | Android: $9.38
Average purchase amount:
iOS: $12.51 | Android: $6.15
Average monthly in-app spending per user for gaming apps:
iOS: $15.34 | Android: $7.31
Average purchase amount:
iOS: $10.96 | Android: $5.53
The Only Category Android Users Spend More:
Average Monthly in-app spending per user for utility apps (ie: anti-virus, memory boosters, etc.):
iOS: $5.21 | Android:$4.01
Average Purchase Amount:
iOS: $3.82 | Android: $7.99
Percentage of users purchasing:
iOS: 4.7% | Android: 21.2%
iOS vs. ANDROID by STATE
States with the most iPhones (as percentage of mobile devices):
- Mississippi (56.75% of mobile devices are iPhones)
- Rhode Island (55.79% of mobile devices are iPhones)
- Illinois (54.27% of mobile devices are iPhones)
States with the least iPhones (as percentage of mobile devices):
- New Mexico (36.86% of mobile devices are iPhones)
- Wisconsin (38.57% of mobile devices are iPhones)
- Ohio (39.57% of mobiles devices are iPhones)